Seasonal Commodity Statistics for September

Stocks typically sell off in mid-september with 30-year treasuries rising as money flows out of the stock market into safer securities.

Crude oil makes seasonal highs and begins to decline during this month as summer travelers reduce gas consumption and the hurricane season is officially over. Hurricane season typically disrupts oil production in the Gulf of Mexico. Also, as temperatures start to shift cooler, refineries start to focus on producing heating oil instead of gasoline.

Copper prices start to fall as the construction season ends and typically remain on a downtrend through December. Silver on the other hand typically starts to rally in September as demand rises. Jewelers start to buy silver in preparation for the holiday season. Also, farmers in India are known to buy precious metals after their harvest which ends through september.

This year Soybeans and grains are very strong due to drought conditions across large parts of the United States. Historically, soybeans are in a weak period during September, reaching their seasonal lows in October when the harvest is over. Corn is typically in a downtrend, although a frost scare can cause price spikes.

Meat prices, such as live cattle tend to rise as the demand for cattle rises in the Fall. Typically people eat more meat as temperatures cool off. Government programs such as school lunches also increase demand as school is back in session.

In the past 12 years, the Euro has rallied 11 times from Labor Day through the end of the month. I am not sure if this year will go with the historical trend, however a Euro rally before the election could be expected. European uncertainties may become more apparent in the next few months during the U.S. election season.

Metals Update

The platinum/gold ratio is rising to what are in my opinion, more healthy levels as the South African platinum scare is tightening platinum supply. Last week’s grizzly standoff at a South African platinum mine left 34 dead, and platinum prices rallying. Platinum prices have taken a hit over the past few years due to falling auto demand, as platinum is a key input to catalytic converter production. The fall in demand for platinum for industrial production, coupled with invests seeking safe haven in gold have caused a significant fall in the platinum/gold ratio.

South Africa accounts for 75% of the world’s platinum supply, with this standoff threatening 40% of the world’s production of the precious metal as workers are protesting wages.

As you can see from the chart below, the platinum/gold ratio is at a historical bottom. I would not hesitate to go long this ratio for various reasons, including platinum’s industrial applications. Platinum is a more rare metal than gold, and I think that it would be a quality investment as investors are flocking from fiat currency investments.


Is the Market Getting Complacent?

For some reason, I cannot figure out why the S&P 500 is so bearish. The Put/Call ratio chart below shows that the S&P is very bullish and overbought. The bullish percent index is also rising, indicating that the market sentiment is still rising. I cannot wrap my mind around why this is happening. This earnings season has been marginal, with analysts expecting such low numbers, making them relatively easy to beat.  I believe that companies beating these expectations is fluff, giving them a reason to rally.

Although it appears that we are in a strong bullish trend, I feel that sentiment is on the edge. The S&P needs the smallest excuse to tilt in the bearish direction, and it could tear lower. I would not place a bullish bet on this index.

VIX Term Structure

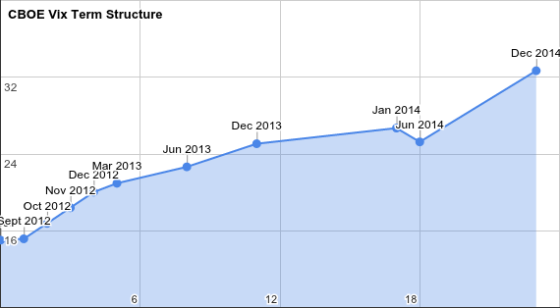
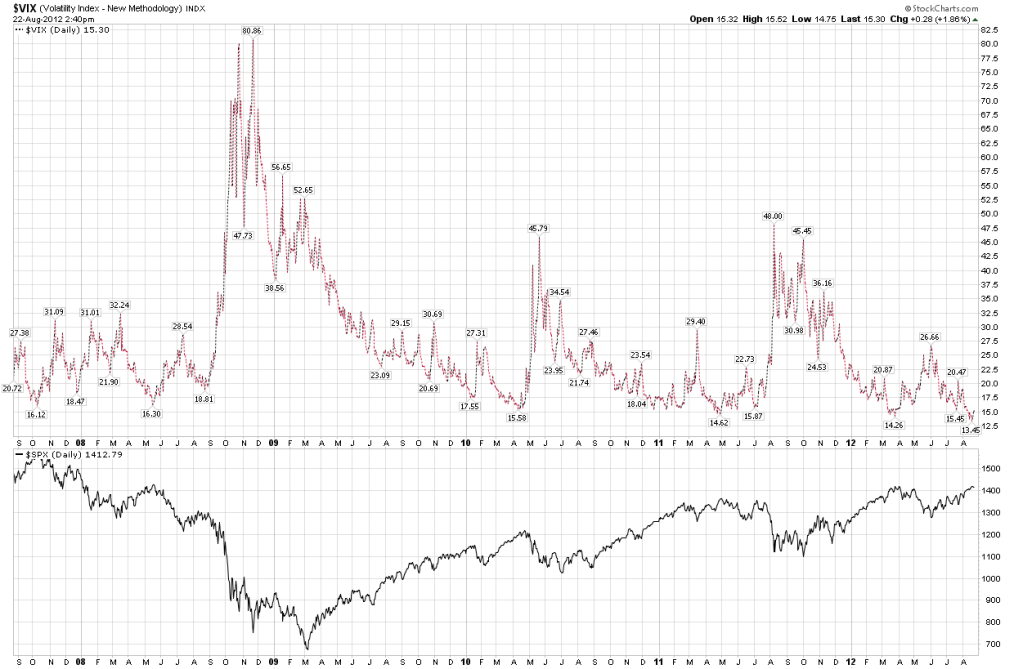
The VIX has been slowly inching up after being crushed last Friday. In the meantime, the front end of the term structure has flattened, with the long end steepening. I remain bullish on the VIX as I am not sure why S&P500 futures have been moving to the upside. The VIX is historically low, and for what? Treasury yields are near their highs, stock indices are high, this just does not make sense.

As far as a VIX play goes, I would bet a bullish spread as I believe the front months with explode to the upside once we get out of the Doldrums. As you can see from the charts below, the VIX is due for some rebuttal after the term structure collapse.

Image

Image

Crude Update

Crude has been inching up over the past week as hopes that the ECB will act and as Middle Eastern tensions linger in market sentiment. WTI crude futures were up 5 out of the past 6 days in a highly bullish trend. Today WTI futures were up .46% to $95.81 with a high of $97.60.

I continue to watch the Brent-WTI Spread. Today the spread was at -$21.72 on a widening trend. I am bullish on this spread and think that it will close. Of course I would set a conservative stop to mitigate Middle Eastern risk.

Grains Update

Grains inched up last week as the realization hit that some of the U.S. crop will be damaged beyond repair after 78% of the U.S. experiences drought conditions. This year’s drought is reported to be the worst in 56 years, causing prices to stay afloat. I would not put on a bearish play in soybeans, corn or wheat unless some very nice yield and weather information is released. We are beginning to discover how the yields have been affected from this summer’s weather.

Earlier in the month, the USDA released a report that corn yields would fall to 6 year lows of 10.78 billion bushels. Now markets are taking time to adjust to the new supply. Although the corn crop yield is considered relatively difficult to heal, there is still some hope for the soybean crop. Soybean yields in late-planted areas could improve if rain sweeps across the U.S.

I am looking to go long spreads in corn, and putting slightly more conservative plays in soybeans as the crop is more likely to heal.

This morning corn futures were trading up 1.13% to $8.0740, soybeans were up .97% to $16.8720 and Wheat was trading down .21% to $8.7260.

South African Platinum Fiasco

Platinum prices are out of control, rising over 4% this week and $37.90 gain today on supply fears in South Africa. Police killed 34 protesting platinum miners armed with machetes as mining unions clashed. The bloodbath took place at Lonmin Plc.’s Marikana mine. South Africa produces over 75% of the world’s platinum, producing roughly 2,000 ounces a day. Considering South Africa’s role in global platinum supply, protests and employment disasters like this can cause a significant price movement.

Platinum producers have been battling falling prices and increased costs associated with mining. Before yesterday, platinum prices were trading down 21% on the year. Today platinum futures were trading at $1472.90 an ounce.

I remain bullish on platinum considering its correlation with gold. The spread between gold and platinum is currently very out of whack with gold currently overpriced with regards to the rarity of the metal.

Natural Gas Update

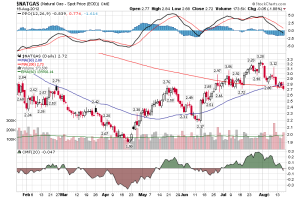
Natural gas prices continued their downward trend over the past week as weather across the nation has cooled off. Last month’s heat wave caused strong demand for the energy source as more Americans cooled their homes with air conditioning, chipping away natural gas reserves. $2.70 is a technical support and I believe that this will be broken soon. I am bearish on natural gas as I believe that $2.00 is a magnet for price action if strange weather exists. The rest of August and September will be tell tails for price action over the winter, just how March’s warm temperatures were a sign for July’s heat wave.

The coming week is expected to be cool along the Eastern Seaboard indicating restrained price bullish movement in the short-term.

The Energy Information Administration natural gas storage number released yesterday reported 20 billion cubic feet of natural gas in underground storage. Analysts were expecting 24 billion, the same as last week’s report.

International Yield Curves

Yield curves are slightly more flat than last week as demand for short-term securities across the globe increased. Traders have kept European yields low in the expectation that the ECB would buy bonds.

German yields reached six week highs after speculation that Spain would ask for a bailout as Spanish yields reached relative lows. Last week at this time short duration German bond were trading more negative than this week. For example, last week’s 6-month German yield was .1%, this week the yield is .02%. I will keep my eye out for any developments in Europe with regards to Spanish bailouts.

Opportunity still exists for traders to profit from the front end inverted yield curves of the UK and Australia.

Treasury Yield Curve Adjustments

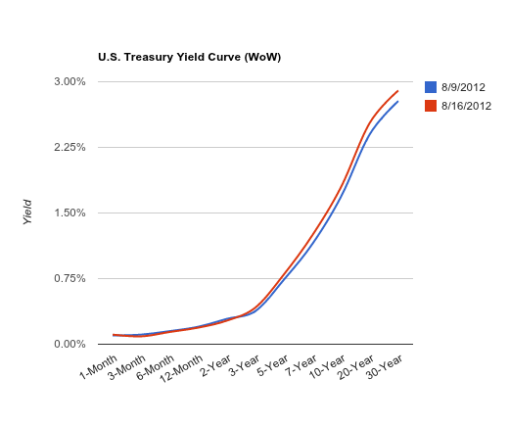
Yields steepened over the week with long duration yields rising on signs that the U.S. economy is healing. I find this highly improbable as I am a bear of the stock market, i.e. Money will flee to safe assets such as U.S. Treasuries.

This morning’s job’s continuing claims number did not completely tarnish the demand for U.S. treasuries, however I believe that the employment numbers are accurate for a few reasons. The Department of Labor and the BLS constantly revise their numbers shortly after they are released, as well as exclude important factors such as parts of the workforce that have given up looking for work and the underemployed.

The treasury should gain traction as Germany, one of the safest assets on the planet, is facing a possible bailout request from Spain. I will be keeping my out out for any yield curve shifts during the next few months with the coming elections. I believe that the elections will be a pivotal event and key names have speculated that QE3 would not happen before the election is over.
Image